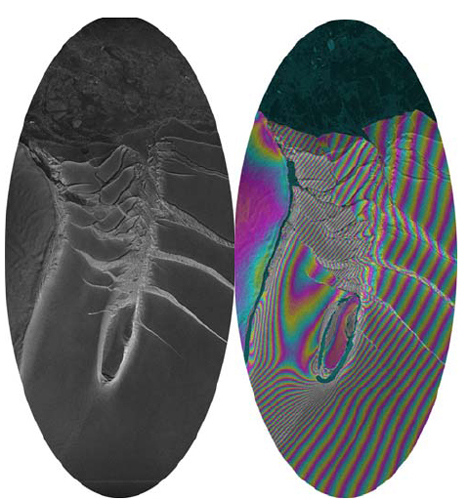
InSAR on IceRadar satellite images help scientists determine ice sheet velocityPosted October 9, 2007
Interferometric Synthetic Aperture Radar (InSAR) is a remote sensing technique that uses radar satellite images. InSAR satellites shoot beams of radar waves toward the planet’s surface and record them after they bounce back off the Earth’s surface. Two pieces of information compose the images. One contains how much of the wave bounced back to the satellite (signal intensity). That depends on how much of the wave has been absorbed on the way and how much has been reflected in the direction of the satellite. This looks much like a black and white camera image, except the intensity of reflected radar energy is different in appearance than reflected light energy. The second information is the ‘phase’ of the wave. When a wave travels through space, think of it as a hand on a clock. It starts on 12 when the wave leaves the satellite. The ‘hand’ (phase) keeps running round and round the clock until the wave reaches the ground. When the wave hits the ground, the hand stops, indicating a certain ‘time’ or ‘phase.’ When the wave comes back to the satellite, it tells the satellite on what value the hand/phase stopped. Every point in a satellite image (pixel) is carrying those two pieces of information: the intensity and the phase. The intensity can be used to characterize the composition of the surface the wave bounced off and what orientation it has. Oil leaks on the sea, for instance, can be spotted in that way. They look much smoother than the surrounding water. The phase is used in another way that’s important for this project. When the radar satellite revisits the exact same portion of the Earth, the phase image should be identical. If that is not the case, then something has been going on. By combining those two images, scientists can measure how much the ice has moved. — Source: USGS and Ian Joughin
Return to main story: Balancing Act |


For USAP Participants |
For The Public |
For Researchers and EducatorsContact UsNational Science FoundationOffice of Polar Programs Geosciences Directorate 2415 Eisenhower Avenue, Suite W7100 Alexandria, VA 22314 Sign up for the NSF Office of Polar Programs newsletter and events. Feedback Form |


