Researchers Release the Highest Resolution Antarctic Map Ever ProducedAntarctica goes from the least-mapped continent on Earth to the bestPosted October 17, 2018
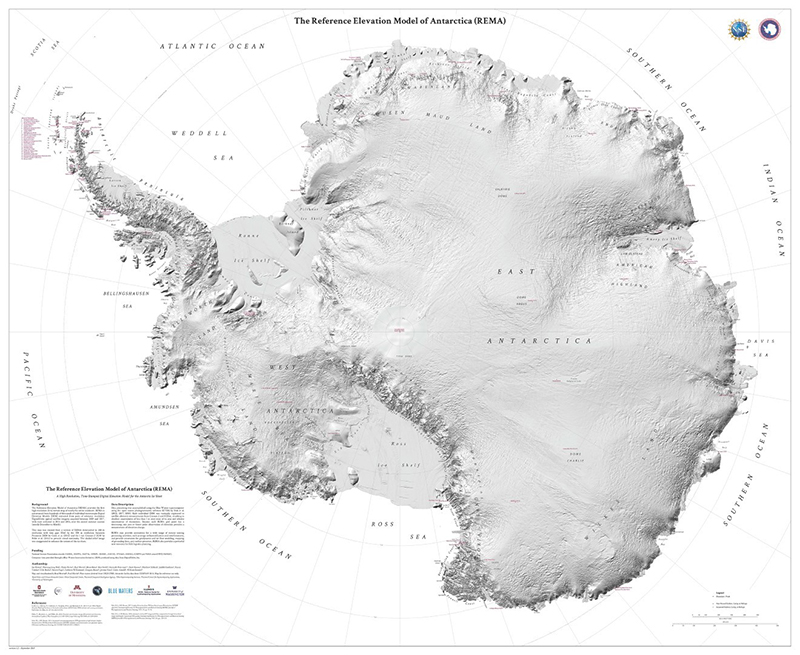
Researchers at the National Science Foundation (NSF)-funded Polar Geospatial Center in September released the biggest and most detailed map of Antarctica ever produced. 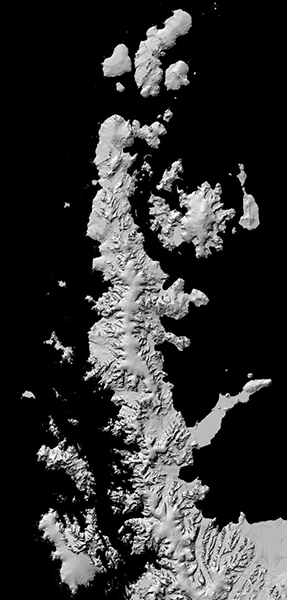
Photo Credit: Polar Geospatial Center
The flow of glaciers along the Antarctic Peninsula is plainly visible.
The digital file is a complete topographic model of the icy continent, accurate down to the size of a car in most regions. "It's not really just a map in the traditional sense, as in places on a piece of paper," said Ian Howat, professor of earth sciences and director of the Byrd Polar and Climate Research Center at the Ohio State University. "It's really a big data set and the data tells you what the surface elevation is." The Reference Elevation Model of Antarctica, or REMA, is what's known as a digital elevation model, essentially a massive, finely detailed, three-dimensional digital file of the surface of the frozen continent. This new terrain map is much more detailed than any previous charts of the continent. "It's like putting reading glasses on for the first time," said Paul Morin, a University of Minnesota earth sciences researcher and the director of the Polar Geospatial Center. The Polar Geospatial Center, located at the University of Minnesota, is supported by the NSF, which manages the U.S. Antarctic Program. Howat and Morin expect that REMA will be a boon to both science and logistics, primarily, but not exclusively, for NSF. The agency in its role as manager of the Antarctic Program facilitates field science on the southernmost continent not only for its own grantees, but also for those of other agencies. Planning and support for Antarctic expeditions and field work, which is carried out by NSF’s Office of Polar Programs, by its nature has to rely heavily on the most accurate estimates of terrain possible in some of the most inaccessible parts of the world. "If you're trying to do the South Pole traverse and you want to move it, we can tell you what the slope is everywhere," Morin said. "We can also tell you the landing elevation of where every [LC-130 Hercules cargo plane] is going to land on the ice sheet. We know the elevation of every mountain to within a few feet." Previously, such models of the full continent had resolutions that ranged from 250 to 1000 meters at best. The new data set has a resolution of about eight meters, over the entire continent, and in some areas resolution as fine as two meters. "There are mountains where the peaks are off by 1000 feet. Now we know them down to the height of a small man," Morin said. Morin and Howat also note that the finished REMA is the result of a coordinated effort across NSF. The REMA team brought their database of photos to the NSF-funded Blue Waters supercomputer at the National Center for Supercomputing Applications at the University of Illinois at Urbana-Champaign, which, when it was built, was the most powerful supercomputer in the world. "Your desktop computer has 4 or 8 cores, this thing has 720,000 cores," Morin said. "It would have taken tens of thousands of years to do the same thing on a desktop computer." Ultimately, the computer produced a digital elevation model about 150 terabytes in size, distilled down from more than a petabyte of raw data. The final product is available through a viewer on their website, a number of pre-rendered maps, or as downloadable data in manageable file sizes. Much of PGC's mission is dedicated to providing up to date, detailed satellite images of remote areas of the polar regions to researchers and support staff heading out into the field. However, they also produce a number of maps and data with a broader scope. 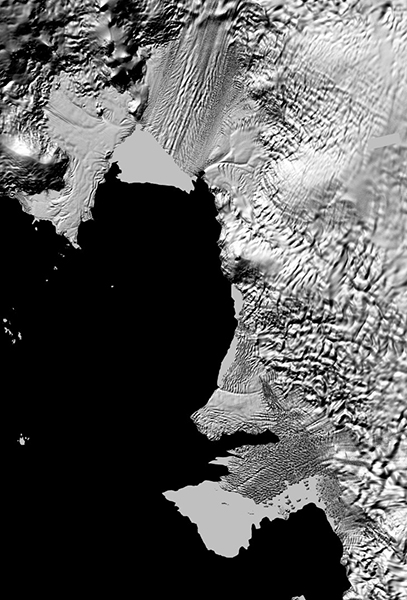
Photo Credit: Polar Geospatial Center
A close up of the renders of Thwaites and Pine Island Glaciers show the amount of detail that the new REMA is capable of.
Assembling such a big and accurate model of an entire continent at this level of detail is unprecedented, even for regions less remote than Antarctica. "Our map has basically taken the worst mapped place on Earth, being the poles, and turned it into the best," Howat said. The map is possible because of the availability of digital imagery through a cooperative effort between NSF and the Department of Defense’s National Geospatial-Intelligence Agency. Part of the NGA's mission is analyzing satellite data from all corners of the planet’s surface. It contracts with a private satellite imaging company called DigitalGlobe Inc. to collect and analyze high-resolution satellite images taken by polar orbiting satellites. Polar orbiting satellites fly along the planet’s lines of longitude, almost directly over the north and south poles. These paths are important to the military and intelligence communities because these satellites can pass over and see nearly any point in the entire world as the planet below rotates on its axis. These orbits all converge around the poles, meaning that the regions with the densest clusters of data are around the poles. "Every orbit around the Earth, they see the pole, so we have the most data collected at the poles," Howat said. "That's really what's enabled us to do a complete map of the continent, and Antarctica is the first continent we’ve been able to do this for." Over the past six years, PGC has amassed an enormous repository of high-resolution satellite photos of both the Arctic and the Antarctic given to it by the NGA. Howat and his collaborator at the Ohio State University, M. J. Noh, developed a computer program to automatically take these photos, analyze them and turn them into a three-dimensional computer model. As they’ve been developing the program, they’ve also released high-resolution sections of the Arctic. The program uses a technique called photogrammetry, where it compares two images of the same spot on the Earth's surface, taken from slightly different angles. By analyzing the differences between the two stereo images, the program can measure the surface elevation and export a three-dimensional image of the terrain. It then stitches that elevation profile together with neighboring areas to get a contiguous terrain map. It takes a fair bit of computing power to analyze and extract three-dimensional terrain data from a single set of images. To do this for the hundreds of thousands of images needed to cover a continent the size of the United States and Mexico combined, they needed access to some serious computing power because "the data sets are just crushingly huge," Morin said. The REMA data will have applications beyond just the immediate ability to safely plan fieldwork, Morin and Howat note. Scientists also can use the map in conjunction with other data to measure how the ice on the surface of the continent is changing. "We can use it with other datasets like ICESat-2 that just got launched," Howat said. ICESat-2 is a new NASA satellite that launched in mid-September. It shoots lasers onto the Earth’s surface to map the height of the ice below. The Antarctic Program is supporting the on-the-ground efforts to ground truth the satellite’s data. This map is another way to check and fine tune the data the satellite is beaming back to Earth, as well as to see how the ice below is flowing over time. "When ICESat-2 crosses over the continent, and it first collects data, we will be able to use that data for change detection because we already have a high precision map of the continent." The team is continuing to collect more imagery and update the map. They're planning on releasing a new, more complete version of the Arctic data within the next month, and hope to release a new version of the Antarctic next year as well. Down the line, they're thinking also about potentially using the program they developed to map out the rest of the planet. "No reason why this can't be done for the rest of the Earth as more and more data are collected." Howat said. "Maybe the low latitudes will catch up with the high latitudes someday." NSF-funded research in this story: Paul Morin, University of Minnesota-Twin Cities, Award No. 1559691, Award No. 1614673, Award No. 1810976. |
"News about the USAP, the Ice, and the People"

For USAP Participants |
For The Public |
For Researchers and EducatorsContact UsNational Science FoundationOffice of Polar Programs Geosciences Directorate 2415 Eisenhower Avenue, Suite W7100 Alexandria, VA 22314 Sign up for the NSF Office of Polar Programs newsletter and events. Feedback Form |