Data downloadIceBridge mission makes ice observations available through NSIDCPosted September 17, 2010
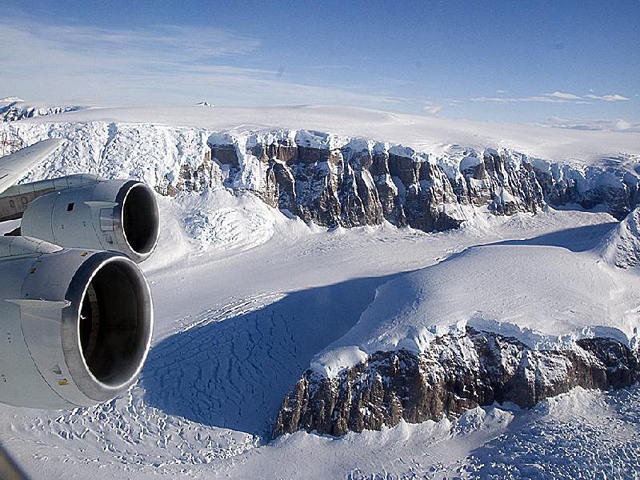
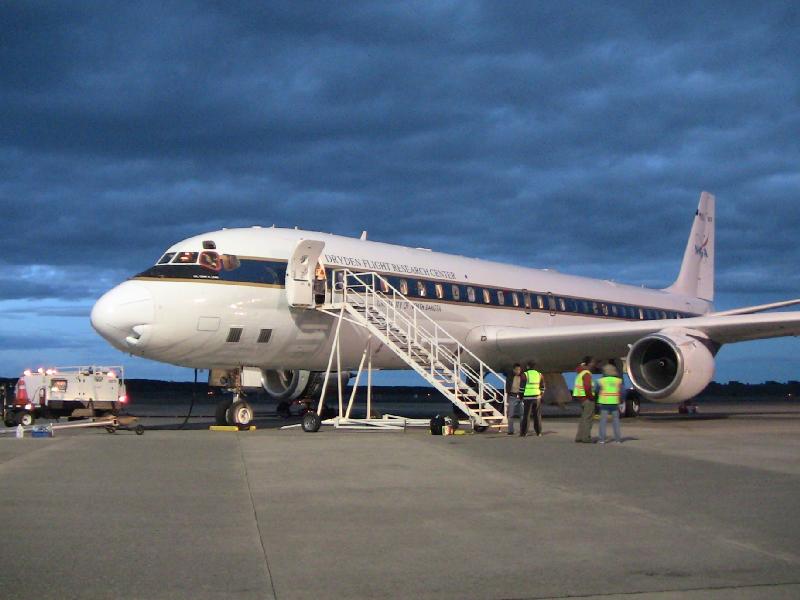
An airborne mission by NASA NASA’s Operation IceBridge The campaign began in 2009, with mission scientists and crew participating in 41 flights and collecting data over about 143,000 miles. [See previous article: NASA IceBridge.]NASA and its designated archive for IceBridge data, the National Snow and Ice Data Center (NSIDC) “Anyone can access the wealth of IceBridge data online, and do so free of charge and without a formal request,” said Michael Studinger NSIDC is part of the Cooperative Institute for Research in Environmental Sciences The NSF is not directly involved with IceBridge, but several radars used on the science campaign were developed by the Center for Remote Sensing of Ice Sheets (CReSIS) The IceBridge mission is a stopgap for the recent decommissioning of NASA’s Ice, Cloud, and Elevation satellite (ICESat) ICESat operated from 2003 to 2009, transmitting data on conditions of sea ice, glaciers, ice sheets and ice shelves. Its ability to measure elevation helped scientists study changes to these features in three dimensions. These data have been urgently needed as the Earth’s polar regions show rapid change as a result of climate warming, according to the NSIDC. A second ICESat satellite is scheduled for launch in 2015. In the Antarctic, IceBridge researchers made a detailed survey of the Pine Island, Thwaites, Smith, Kohler and Crane glaciers, while another instrument peeked at the detailed topography under Pine Island’s floating ice tongue. They collected the first airborne data for sea ice in the Weddell and Bellingshausen seas. To date, NSIDC has published twelve data sets from the IceBridge “It’s exciting to have such a diversity of data, preserving it for the future and making it available in ways that will encourage new discoveries,” said Marilyn Kaminski |


For USAP Participants |
For The Public |
For Researchers and EducatorsContact UsU.S. National Science FoundationOffice of Polar Programs Geosciences Directorate 2415 Eisenhower Avenue, Suite W7100 Alexandria, VA 22314 Sign up for the NSF Office of Polar Programs newsletter and events. Feedback Form |


