Valley of buried iceGarwood reveals layers of climate history from Last Glacial MaximumPosted March 16, 2012
The McMurdo Dry Valleys The maze of valleys sits at the edge of the East Antarctic Ice Sheet, its mighty glaciers frozen at the doorstep of these bone-dry corridors of stratified rock. A program called the McMurdo Dry Valleys Long Term Ecological Research More Information
While a sensitive barometer to present-day climate change — a warm summer day can cause dramatic floods capable of rehydrating microorganisms and sweeping away carefully constructed experiments — the Dry Valleys are also proving to be a useful tool to understand climate change during the end of the last ice age. In particular, a small valley at the southern extreme is offering researchers a very high-resolution snapshot of when the West Antarctic Ice Sheet ebbed and flowed through the region during a period known as the Last Glacial Maximum (LGM). “Garwood is a very special place in the Dry Valleys, because not only do we have a record of ice filling the valley when the West Antarctic Ice Sheet was expanding, but we also have the record of when the West Antarctic Ice Sheet started melting back,” explained Joseph Levy The LGM reached its peak about 18,000 years ago when large ice sheets extended across both the northern and southern hemispheres. In Antarctica, the West Antarctic Ice Sheet spread across the Ross Sea, where the world’s largest ice shelf remains today. It also spilled into the Dry Valleys across McMurdo Sound, filling them with ice. In Garwood, a relatively shallow valley, the West Antarctic Ice Sheet pushed its way uphill, eventually damming a river that flows from a glacier at the other end of the valley, according to Levy. The river melted out a small lake into the ice, dumping an enormous amount of sediment to create a huge delta. Sediment along the walls of the valley also buried the intrusive ice. In fact, a large section of that ice, thousands of years old, remains buried at the edge of the valley. “It looks like this was a very muddy puddle that ponded up in front of the West Antarctic Ice Sheet,” Levy explained, adding that the delta was the dominant feature. “It’s exceeding tall and exceedingly large. You can see it from space. This is a big delta.” Eventually, as the ice age, known formally as a glacial period, waned and the ice melted back, the lake poured out of the Garwood Valley, like a plug pulled out of a sink drain. Previous research suggested the grounding line, where the ice still touches bedrock, likely retreated away from the mouth of Garwood Valley between 6,000 and 6,500 years ago. Levy said a series of analyses his team will make from sampling various features in the Garwood Valley will be able to pinpoint the timing of when the ice sheet flowed into and out of the area. One piece of evidence involves algal mats buried in layers in the lake delta. Carbon dating will provide a precise number for when the delta was built, which relates to when the West Antarctic Ice Sheet dammed the river that flowed from the East Antarctic glacier. The algal mats reveal another “biological” clue left over from when the lake formed. As the lake grew, algae living in the delta were buried, along with the shells of microscopic organisms that produce calcium carbonate shells. The uranium in the calcium carbonate decays into thorium, a process that allows the researchers to date the material very accurately. A third dating technique call optically stimulated luminescence (OSL) — what Levy refers to as the most “black magic” of the methods — can measure surface ages that contain certain minerals such as quartz. The quartz essentially captures natural radiation from the surrounding rocks and space, which it releases when exposed to light. 
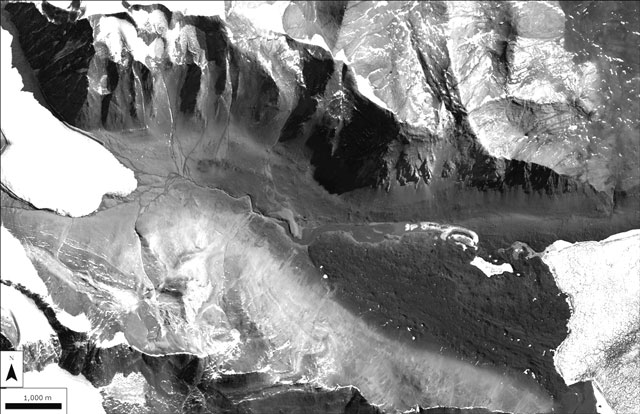
Image Credit: Polar Geospatial Center; Imagery Copyright 2010 DigitalGlobe, Inc.
A satellite view of Garwood Valley. The glacier that feeds the modern Garwood River is at left. The ice sheet during the LGM would have flowed in from the right side.
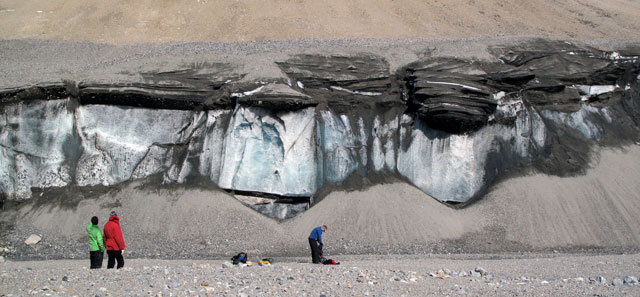
Basically, the OSL measurement will tell scientists how long it’s been since the quartz crystal had been exposed to sunlight, which indicates when a particular layer of sediment was laid down before it was buried. “We’re combining all three of these geological clocks to figure out exactly when ice came in, when the deltas formed, when the lake drained,” he said. “We have the whole story of the Last Glacial Maximum and then into the current warming we’re experiencing now preserved in Garwood Valley.” All those high-tech methods require a lot of low-tech muscle to gather the samples needed for the different analyses. “We’re mainly collecting a lot of dirt, digging a lot of holes and collecting a lot of rock,” Levy said. But the Garwood Valley isn’t just a neat place to study glaciological and geological history, according to Levy. “It’s not just a backward-looking place. It’s also sort of a crystal ball for the future of the Dry Valleys,” he said. It was certainly a colder place during the LGM, about 6 to 8 degrees Celsius cooler, according to estimates. By reconstructing how the landscape changed as it warmed, Levy and colleagues can predict how the Dry Valleys might evolve as the remainder of the buried ice in Garwood and other valleys melt. In addition, thanks to an exposed cliff face where the buried ice is visible, like a fat layer of cream in an Oreo cookie, the researchers are doing another experiment to see how much energy the valley wall receives via a weather station and how much melting occurs. Laser measurements using an instrument called a LIDAR can map the landscape changes in great detail. “It’s a neat little interdisciplinary project,” said Levy, whose collaborators include Andrew Fountain at Portland State University
NSF-funded research in this article: Joseph Levy, Oregon State University, Award Nos. 1212307 and 1043785 |


For USAP Participants |
For The Public |
For Researchers and EducatorsContact UsU.S. National Science FoundationOffice of Polar Programs Geosciences Directorate 2415 Eisenhower Avenue, Suite W7100 Alexandria, VA 22314 Sign up for the NSF Office of Polar Programs newsletter and events. Feedback Form |


