Coloring outside the linesSpectral mapping technique offers new view of old rocks in AntarcticaPosted October 17, 2014
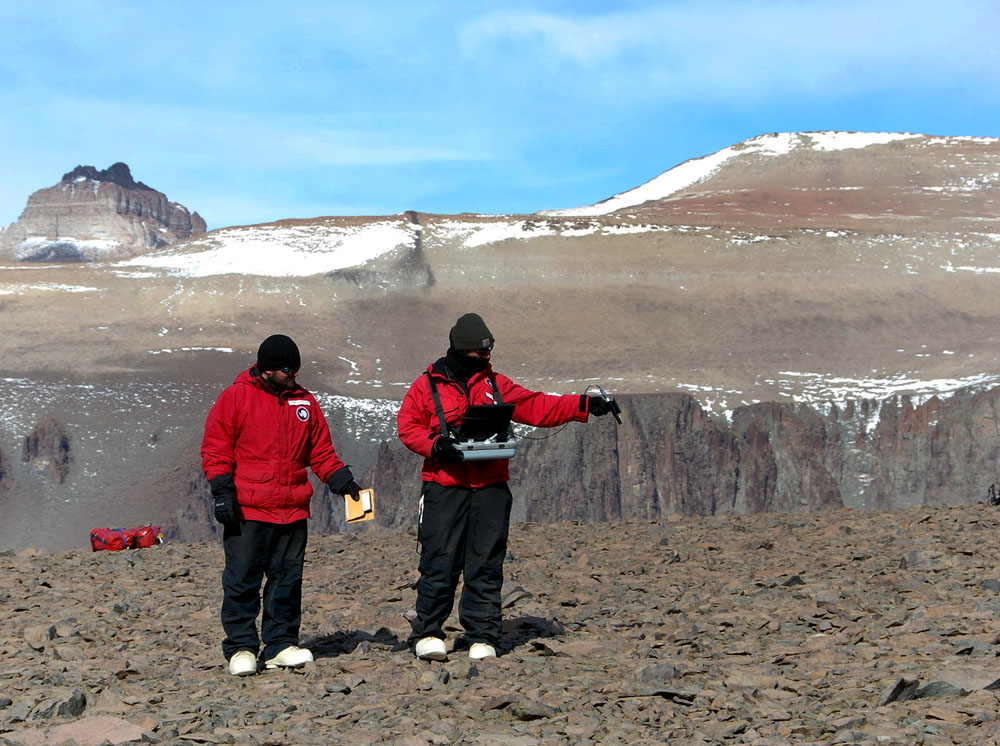
Exploration of other planets and moons, such as Mars or Europa, often begins in Antarctica. The continent’s extreme environment and unique ecosystems provide a useful analog for understanding what conditions may exist elsewhere in the universe or what technologies might work best for future exploration of other worlds. Mark Salvatore, a geologist who specializes in research of planetary surfaces using remote-sensing techniques, is working in the opposite direction. He is applying his experience in studying Mars to learn more about the geology of a remote stretch of mountains in Antarctica. NSF-funded research
Mark Salvatore, Arizona State University, Award No.
1414378
The result is a high-resolution spectral map of the Shackleton Glacier region of the central Transantarctic Mountains. The interactive map A major field camp is proposed to be located in the region for the 2015-16 summer field season. The spectral map is designed to help researchers plan field operations based on the types of rock outcrops suggested by the analysis of remote-sensing data. “Antarctica is essentially a planetary surface. It’s difficult to get there. It’s resource limited. Any legwork you can do ahead of time is extremely helpful,” explained Salvatore, a postdoctoral research associate at Arizona State University. “I’m interested in helping the community out with this product. The spectral map in and of itself may not be useful, but the spectral interpretations is really where it’s going to become very valuable,” he added. Multispectral images capture data across the electromagnetic spectrum at specific wavelengths, including those beyond the visible light range, such as in the infrared. For each spatial resolution element in the image, a sensor measures its spectrum of the surface. These spectra are used to derive information based on the signature of the interaction of matter and energy expressed in the spectrum, according to a description from NASA. 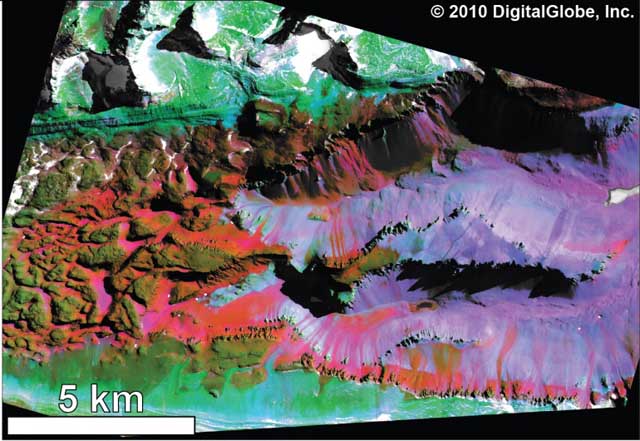
Photo Credit: DigitalGlobe
A spectral map of upper Wright Valley in the McMurdo Dry Valleys.
In this case, spectral imaging can extract information about rock types found in the Transantarctic Mountains. The project used data captured by WorldView-2, a commercial satellite built and operated by DigitalGlobe, Inc. The PGC, located the University of Minnesota and funded by the National Science Foundation, uses imagery from DigitalGlobe through the National Geospatial-Intelligence Agency’s commercial imagery program to create maps and other products of the polar regions. The spatial resolution of the spectral map, or SPECMAP, is more than 50 times higher than the regional geologic mapping efforts that took place in the late 1960s. Salvatore will use about 460 specimens from the Polar Rock Repository, located at The Ohio State University, to help calibrate satellite data by using 2,800 spectra to calibrate the next version of SPECMAP. [See related article — Almost like being there: Polar Rock Repository offers access to samples from Antarctica without leaving lab.] “[The spectral map is] a good example of how to tie historic ground observations and samples from the Polar Rock Repository with the new satellite imagery to bring geologic mapping into the 21st century,” said Spencer Niebuhr, a former undergraduate geospatial analyst with PGC. Salvatore said that spectral mapping is an under-utilized resource – but it’s not a substitute for doing geology in Antarctica. "We're not trying to replace field geologists by doing all of this from orbit."
“We’re not trying to replace field geologists by doing all of this from orbit,” he said, noting that the technique has limitations and uncertainties. “We can’t do it without traditional fieldwork, but I think it can also help drive the traditional fieldwork.” Salvatore’s own fieldwork in Antarctica has taken him to the McMurdo Dry Valleys, a relatively ice-free region of the continent that has been well-mapped, geologically speaking. In Beacon Valley, Salvatore identified the chemical weathering of certain surfaces, proving that it was possible to discern spectral signatures among the varied lithography of the region. Spectral data from the Shackleton Glacier region could also be used to identify biological activity, specifically if it occurred on a large enough scale. The WorldWiew-2 sensor was originally designed to catch small-scale vegetation changes, Salvatore explained. “It’s using the techniques and skills I’ve learned about processing Martian data,” he explained, “and using them to the advantage of how we can do it better in Antarctica.” |

For USAP Participants |
For The Public |
For Researchers and EducatorsContact UsU.S. National Science FoundationOffice of Polar Programs Geosciences Directorate 2415 Eisenhower Avenue, Suite W7100 Alexandria, VA 22314 Sign up for the NSF Office of Polar Programs newsletter and events. Feedback Form |